Libraries as urban infrastructure
As libraries take on a greater role as community centres and fill social-service gaps, we need to understand the challenges they confront as a result of changing demographics and social needs in their local areas.
This preliminary study was requested by the Canadian Urban Libraries Council. We conducted a spatial analysis, mapping over 500 urban libraries and a series of census variables to determine how demographics differed within library service areas and the wider city context.
Overall, findings demonstrate systematically higher levels of social need within library walk-sheds, with higher core housing need, lower income, higher unemployment, and more visible minorities and immigrants when compared with surrounding areas.
Below we summarize some key results; the slides from the accompanying presentation go into more detail on the spatial anlaysis, and address a set of other questions related to libraries as urban social infrastructure.
Comparing library service areas with the rest of the city
We define on-foot library service areas as 1-km “walksheds”—areas within one kilometre (a convenient walking distance) of a library. We then compare the demographics of these areas with the rest of the surrounding urban region. Figure 1 shows, for example, the library walksheds look like in downtown Montreal, overlaid on a map of “core housing need” (a measurement of housing unaffordability and inadequacy).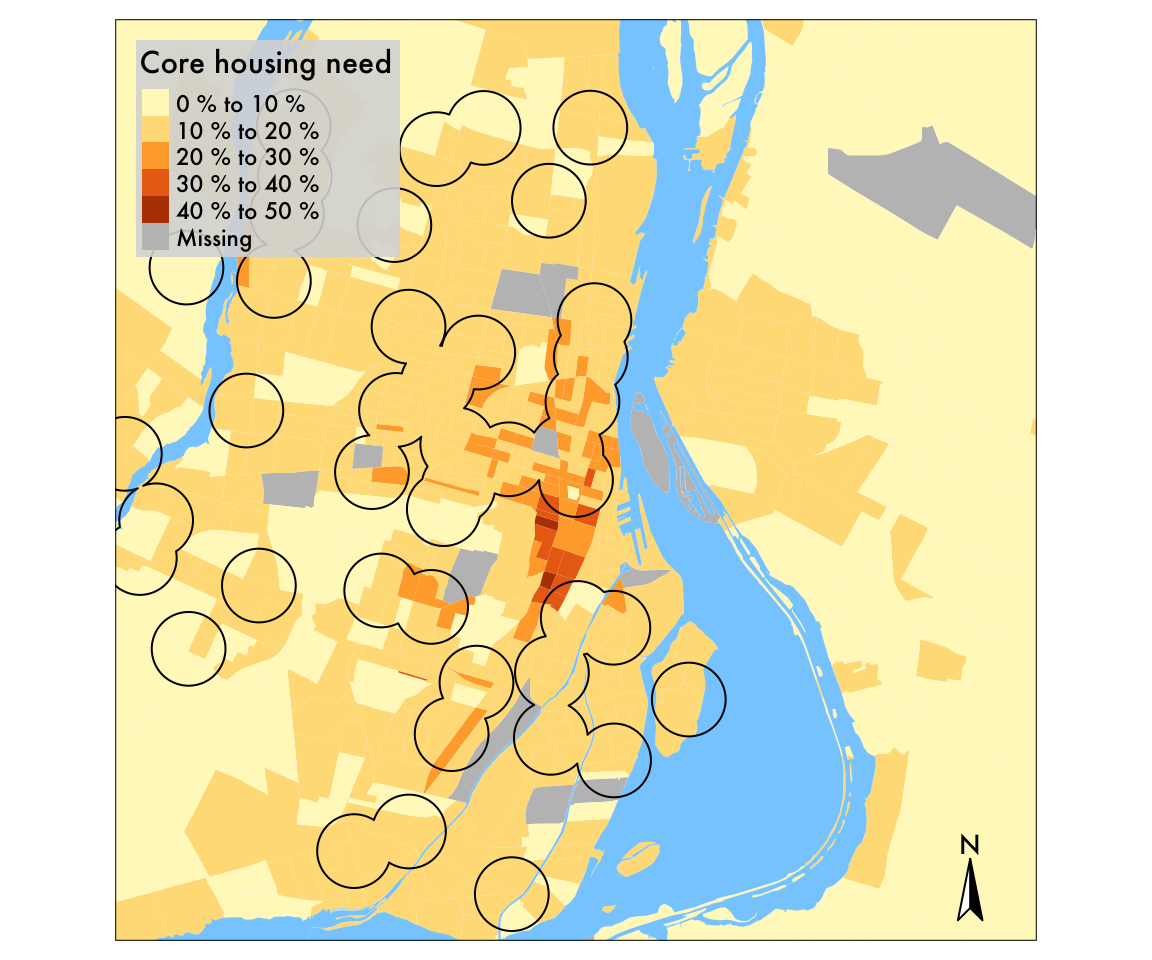
Figure 1: Distribution of housing need in Montreal. The core housing need is 57% higher within library walkshed than in the rest of the CMA.
In fact, the core housing need is 57% higher within library walksheds than in the rest of the Montreal region. (It is 14.4% inside library walksheds, and 9.2% outside.)
This relationship holds up in every other city, as Figure 2 shows. In general, the percentage of families in core housing need is 23.2% within library service areas, and 15.3% outside of them.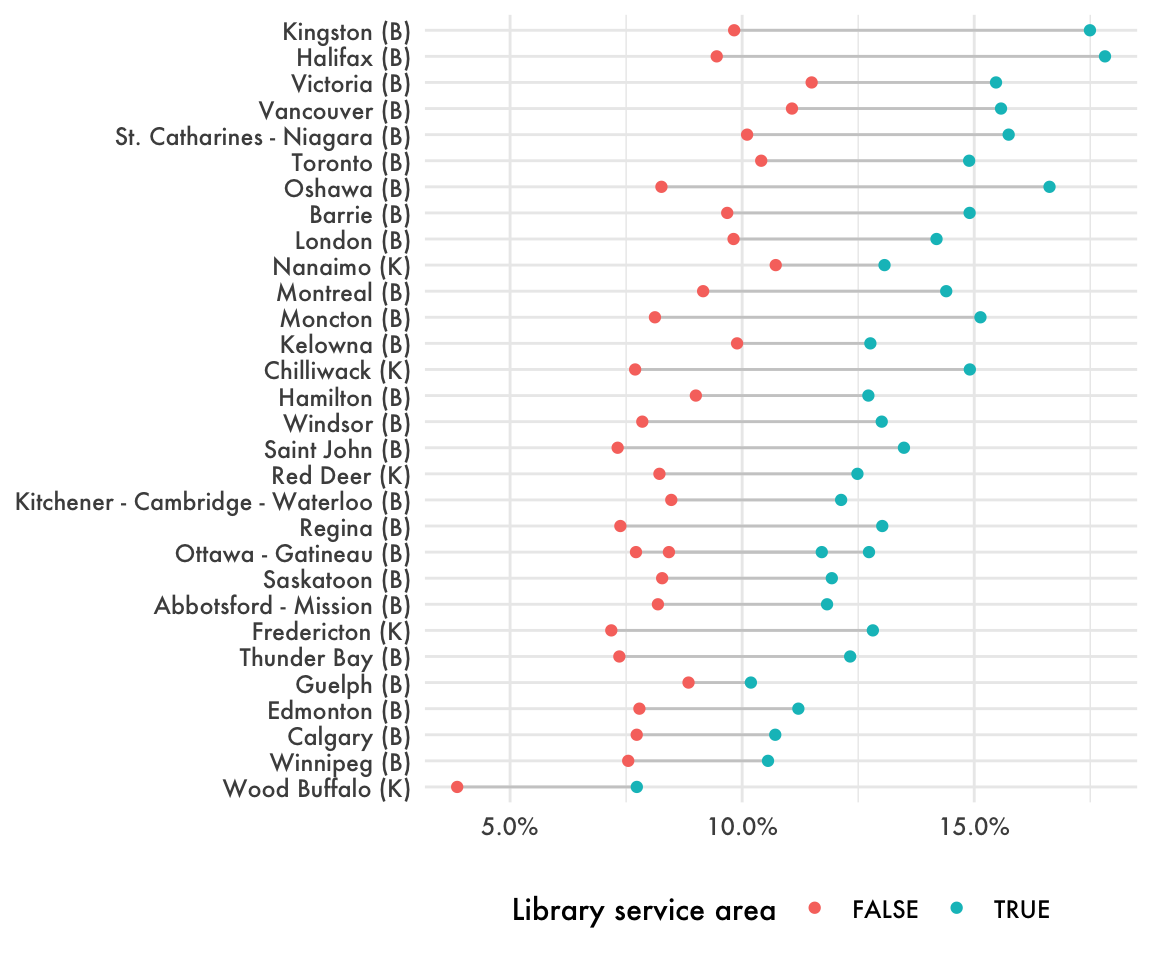
Figure 2: Housing need in library walksheds. Housing need is higher in library walksheds in every single city in the country.
Urban demographics over time
Comparing census data from 2006 and 2016, we found that these patterns of greater social need in library walksheds are not new; social disparities between library service areas and the rest of their city-regions are relatively large and mostly growing (Figure 3).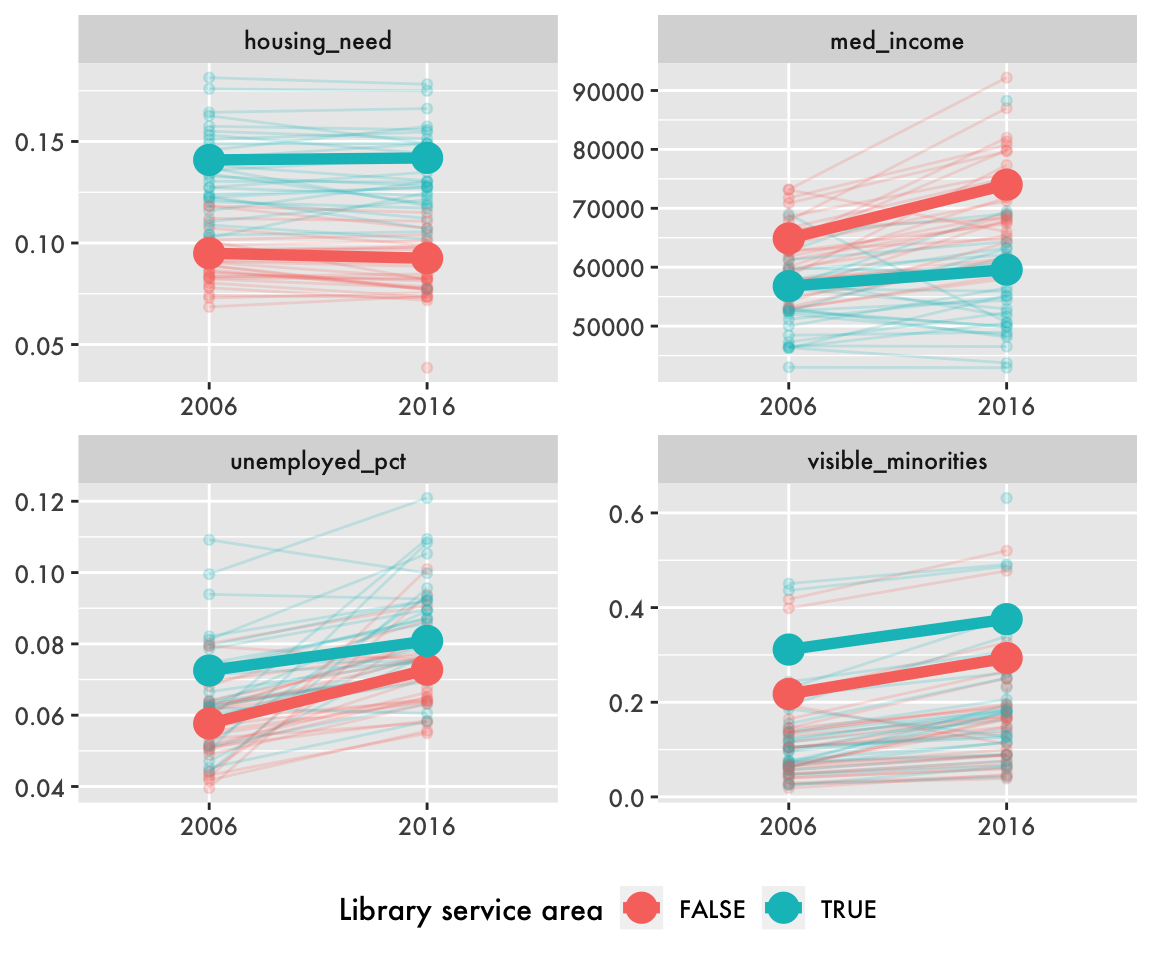
Figure 3: Change in demographic variables from 2006 to 2016. Gaps in housing need and median income widened, while gaps in unemployment rate and visible minority rate narrowed.
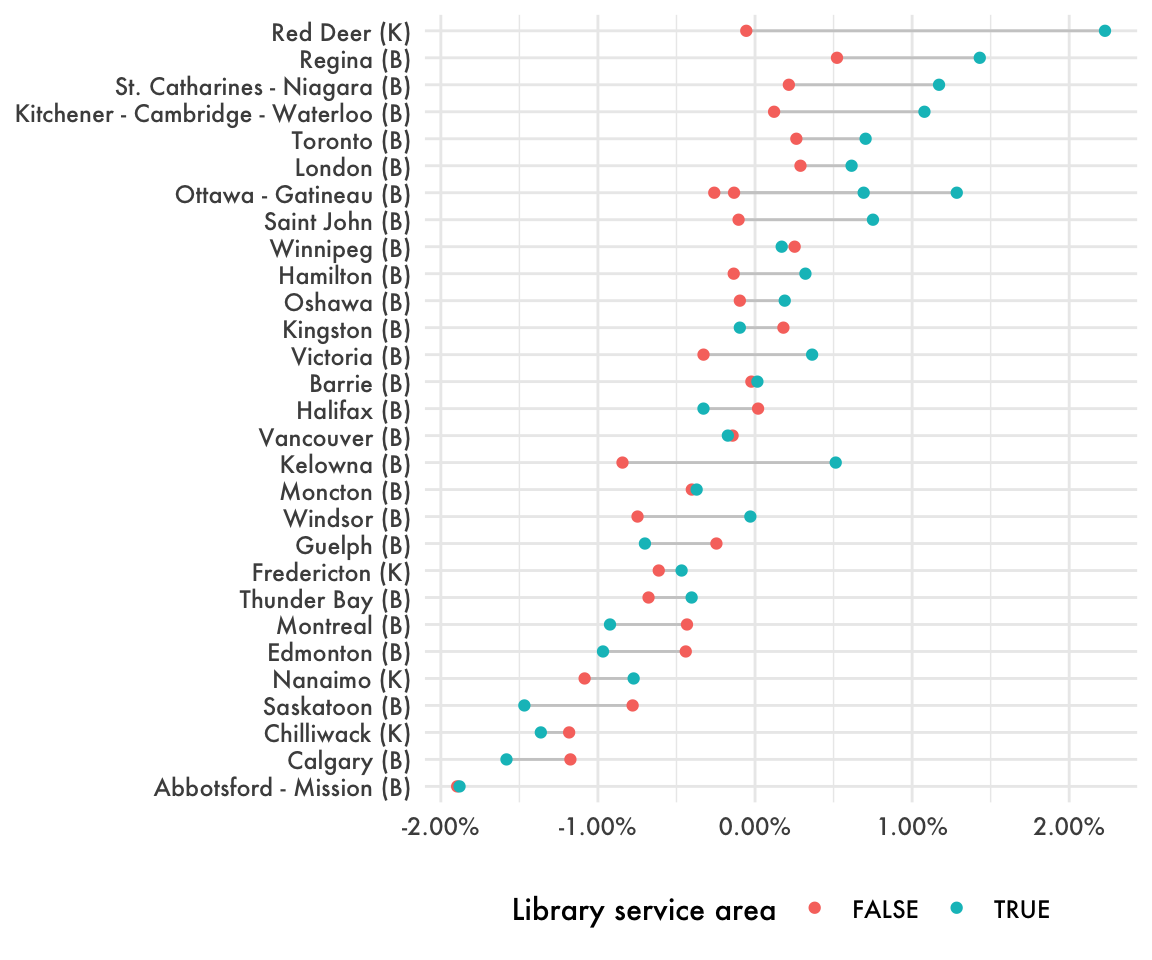
Figure 4: Variation in housing need change from 2006 to 2016. While most cities have seen the housing need gap between library service areas and the rest of the city widen, some cities have defied this trend.
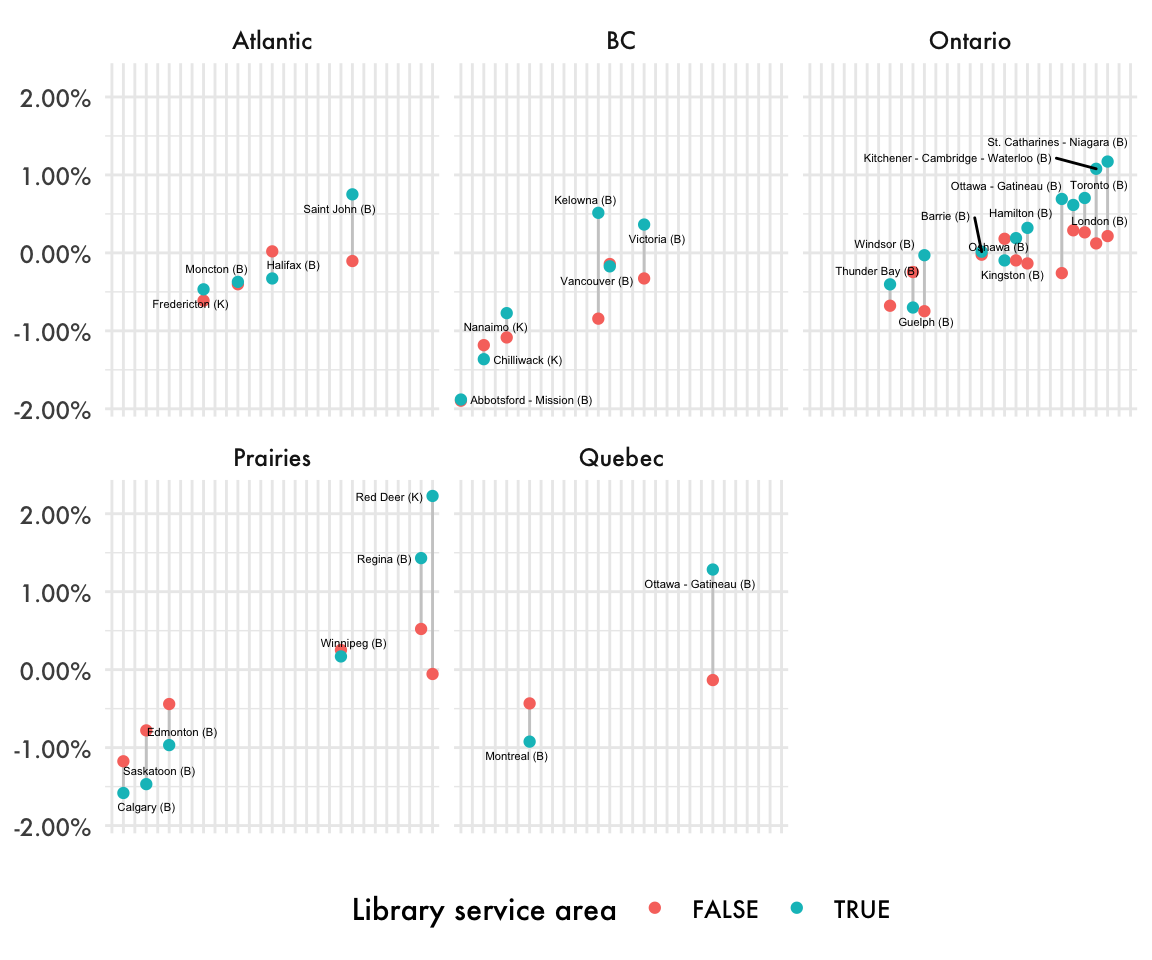
Figure 5: Variation in housing need change from 2006 to 2016, grouped by region. Ontario has worsened, BC has improved, and the Prairies are strongly divergent.
Changing patterns of urban development have shifted—and will continue to shift—libraries’ local contexts and roles. With growing social need in library walk-sheds, libraries are becoming increasingly important spaces for community services, moving away from the traditional mission of public libraries. However, evidence suggests that while municipal officials are supportive of libraries, they do not fully understand the range of services that they may provide; stagnating or declining higher-level funding is thus a serious threat.
Examples from across Canada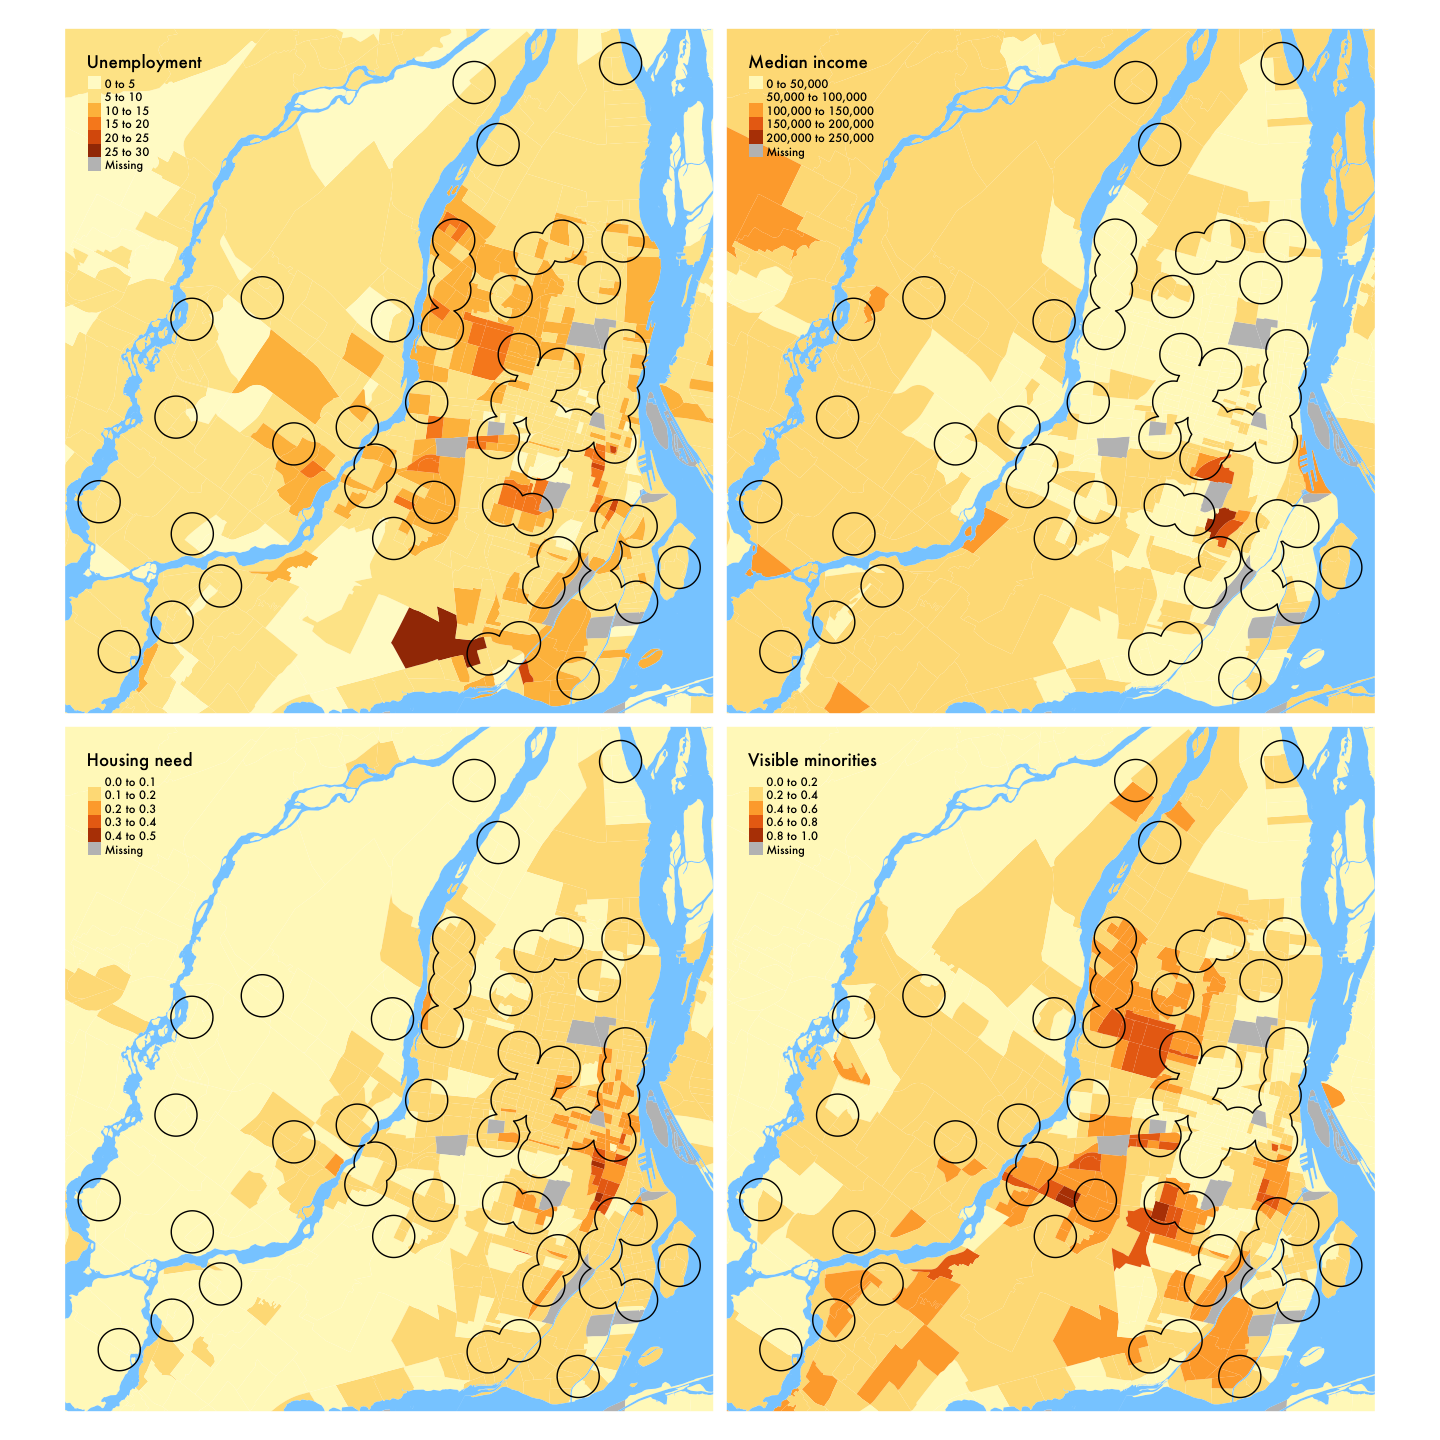
Figure 6: Demographic variables in Montreal (library service area), 2016
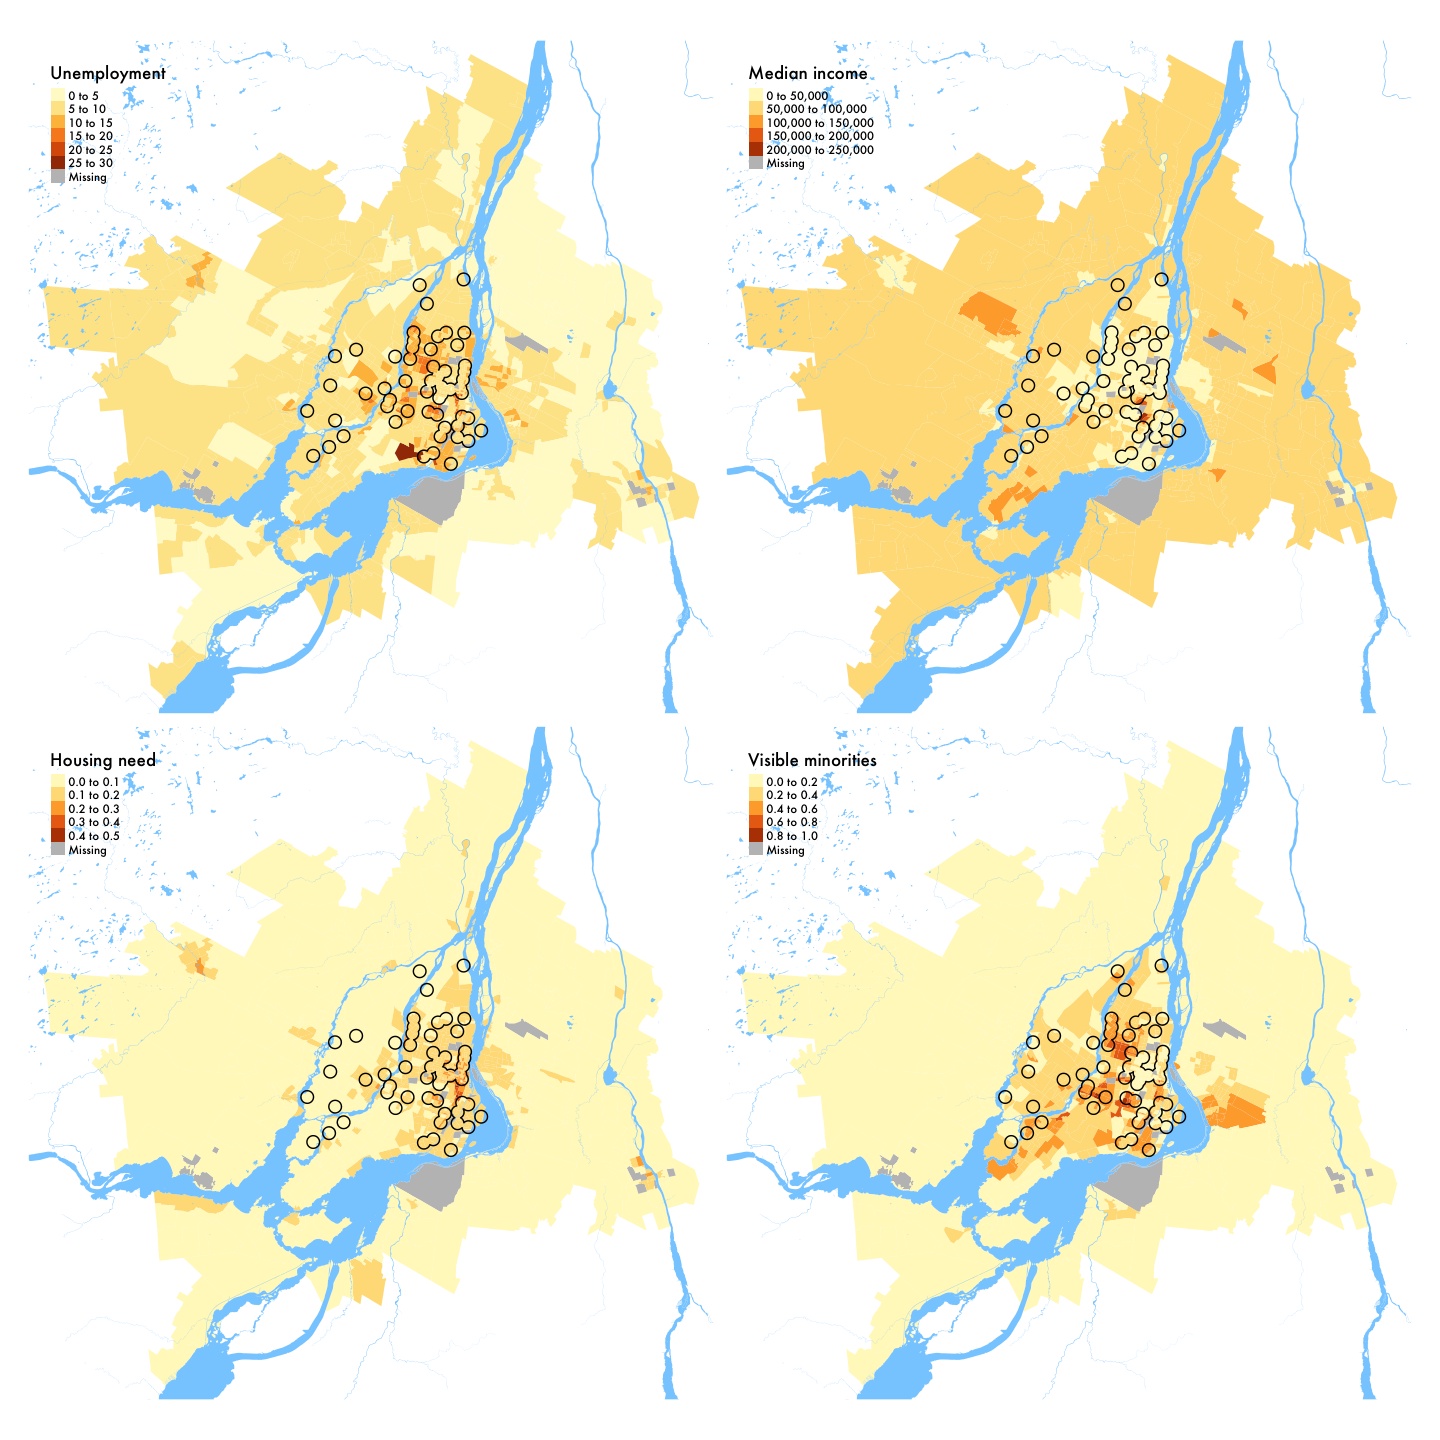
Figure 7: Demographic variables in Montreal (region), 2016
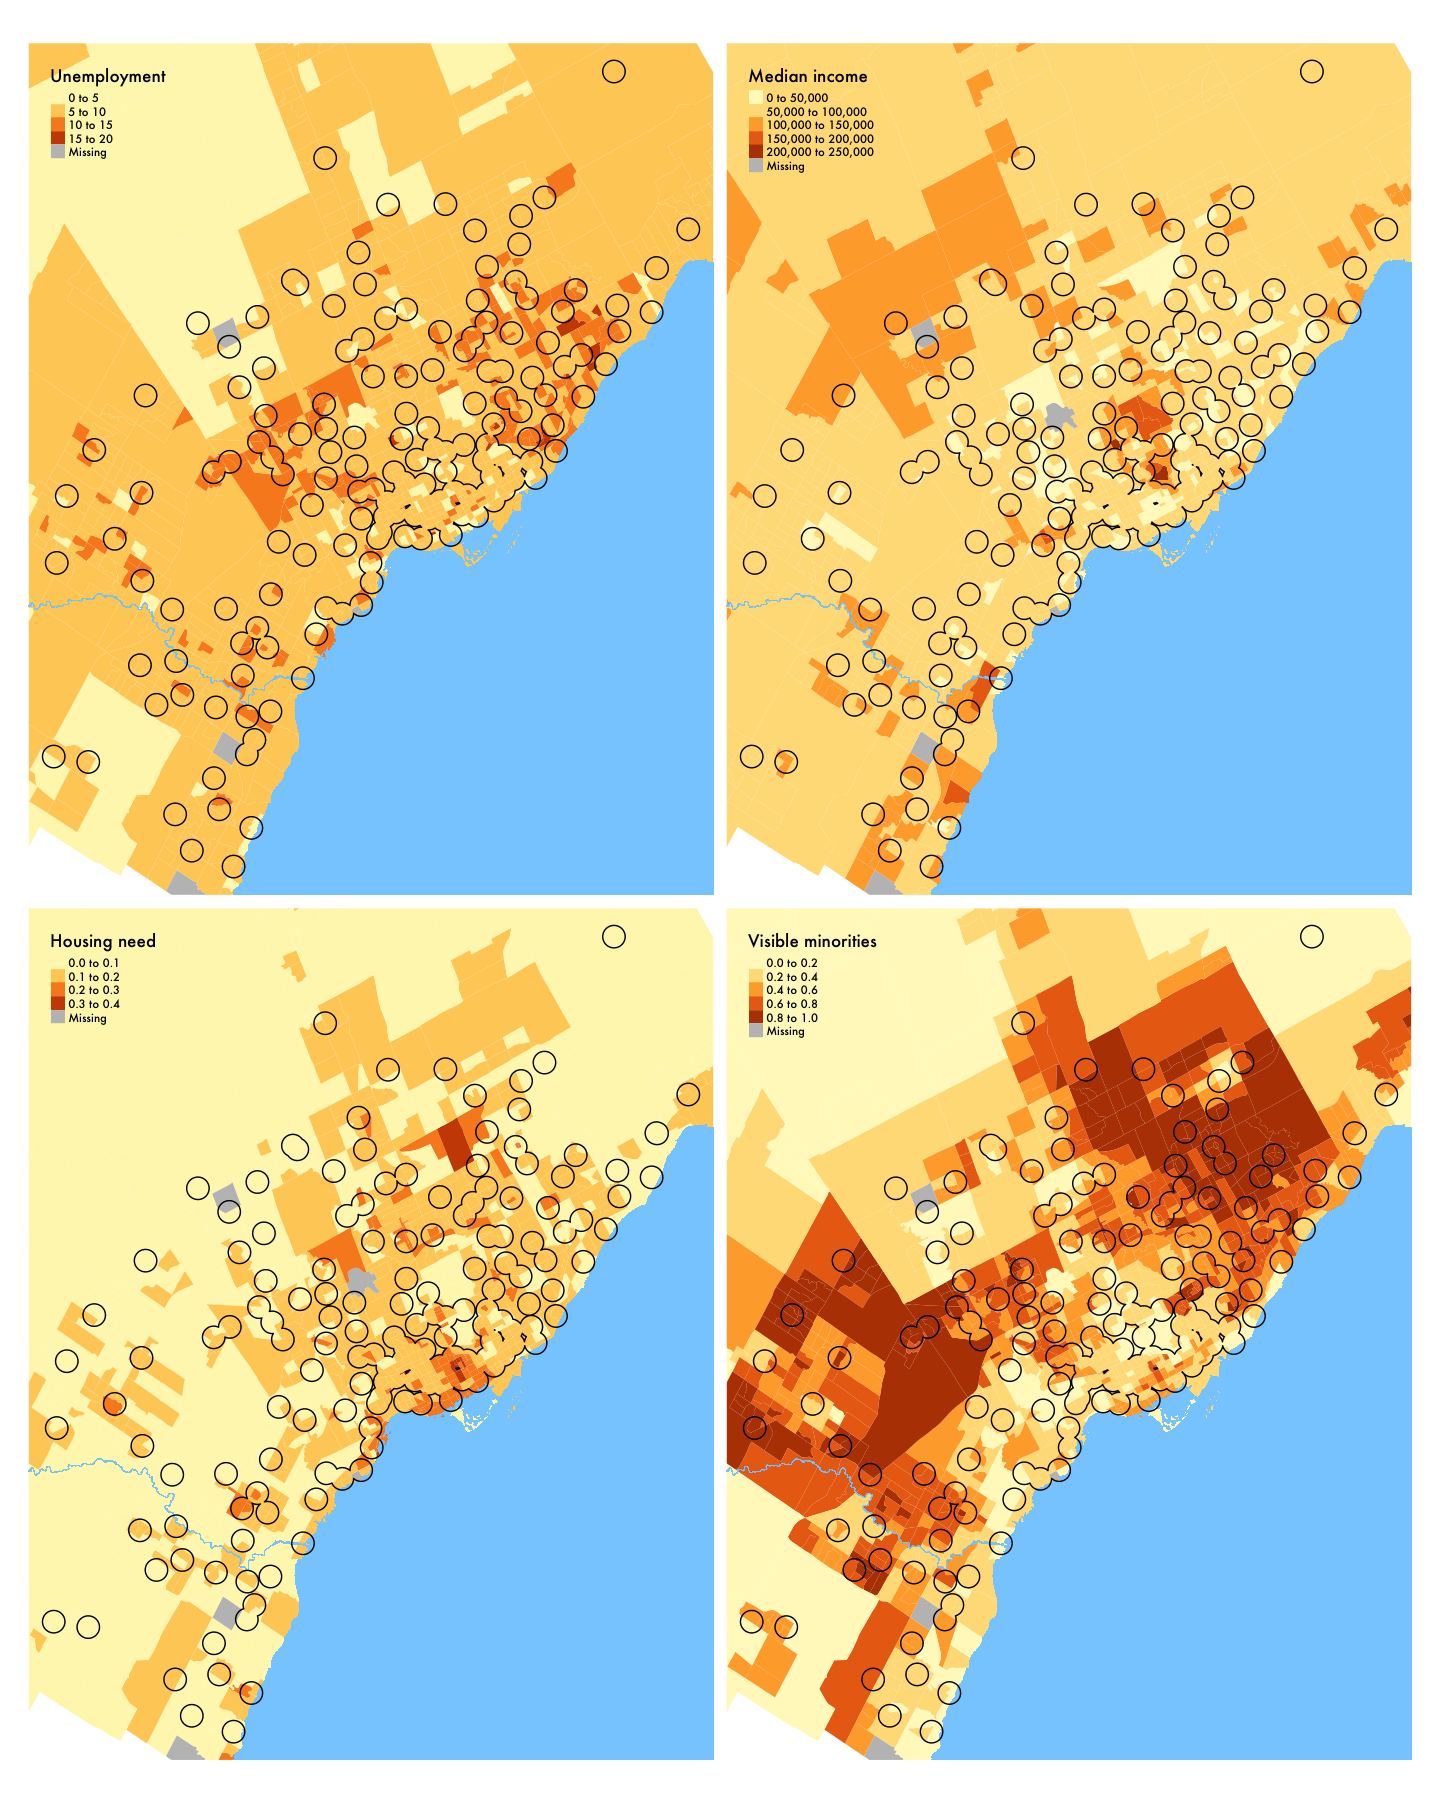
Figure 8: Demographic variables in Toronto (library service area), 2016
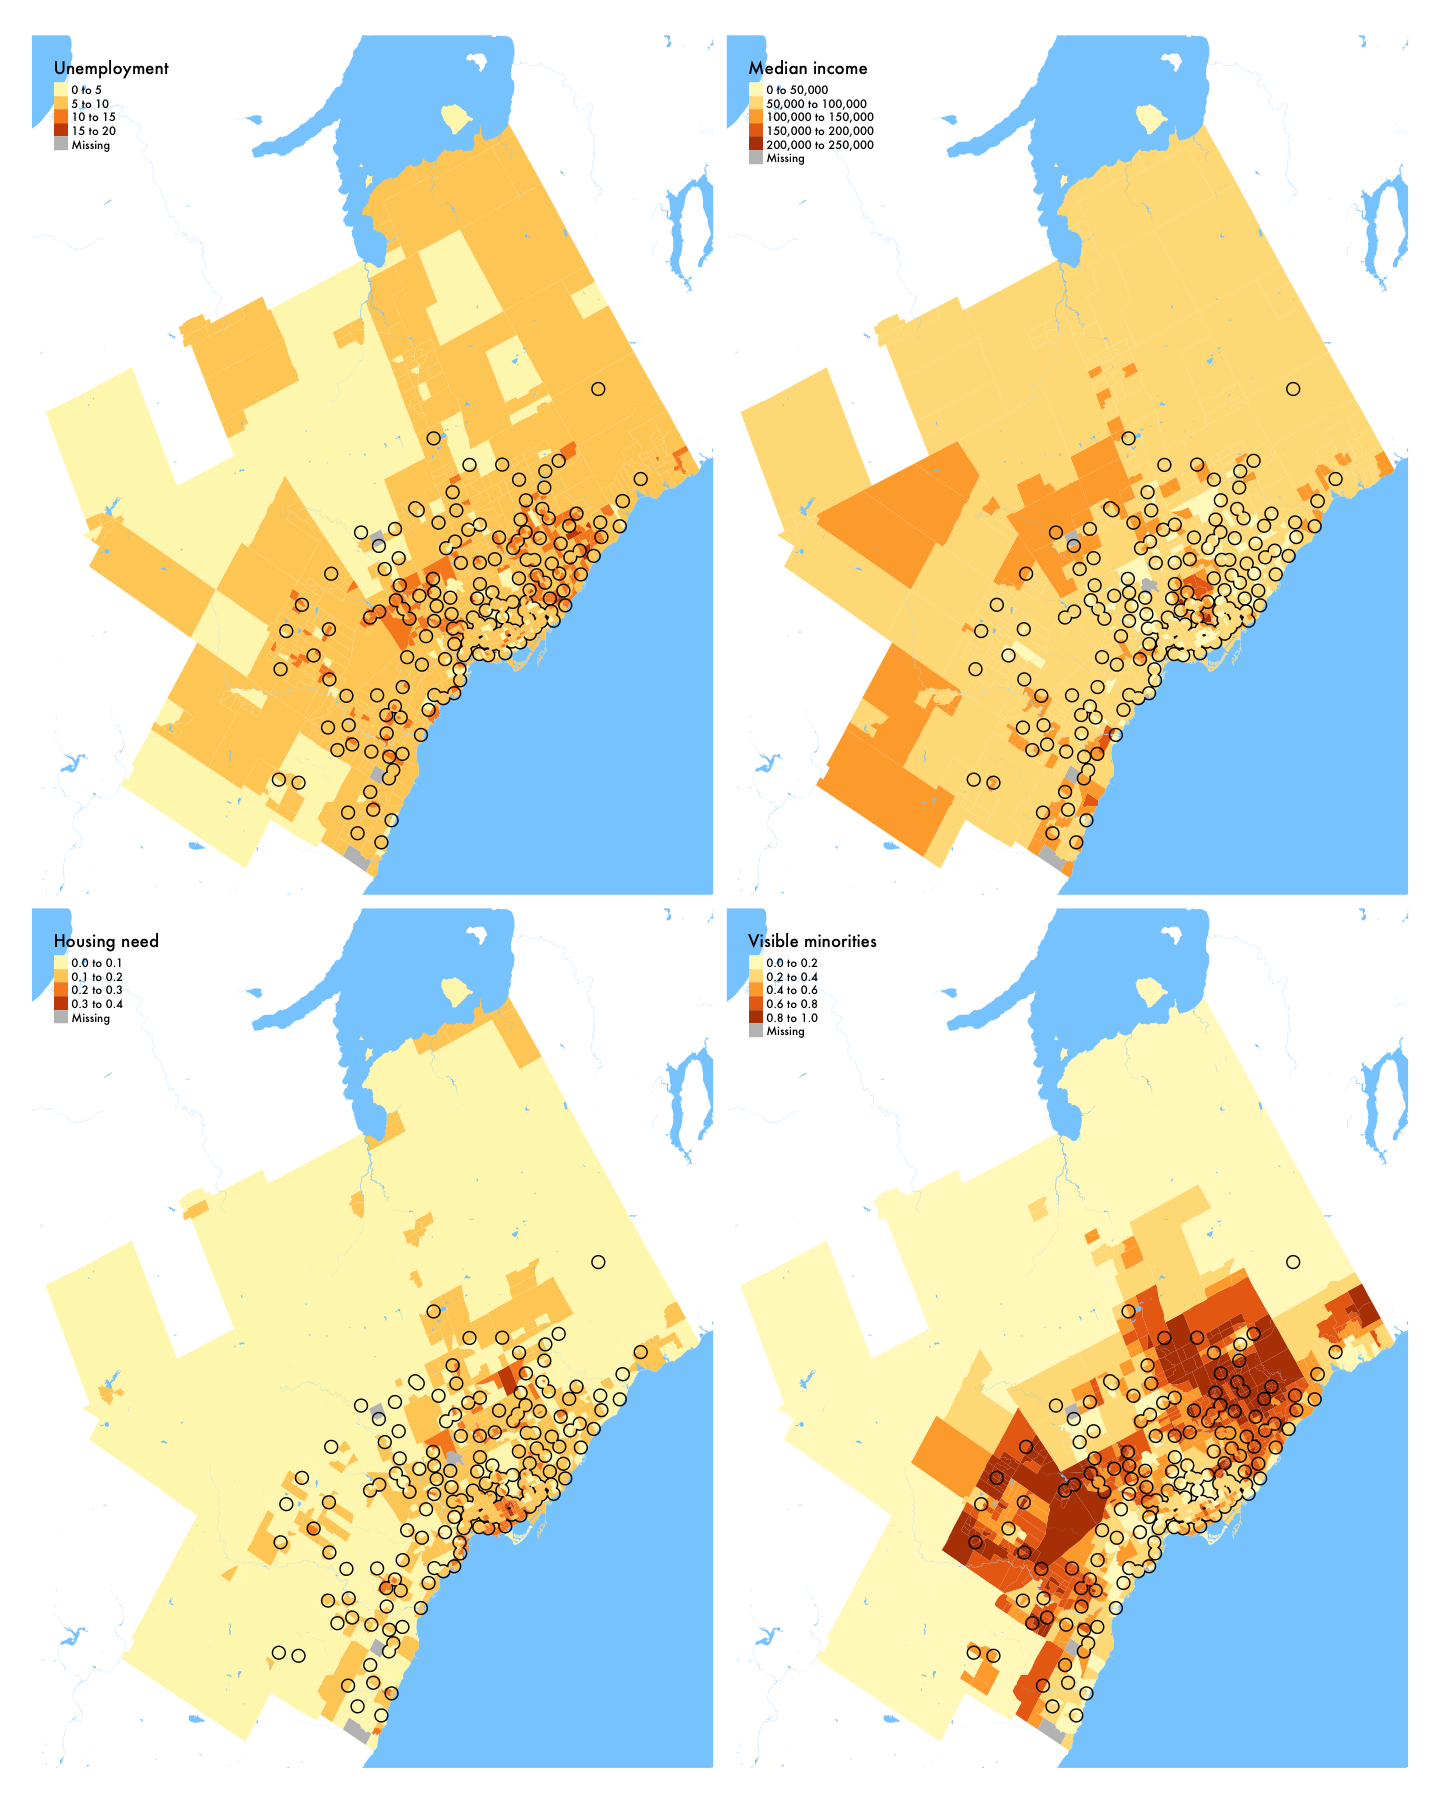
Figure 9: Demographic variables in Toronto (region), 2016
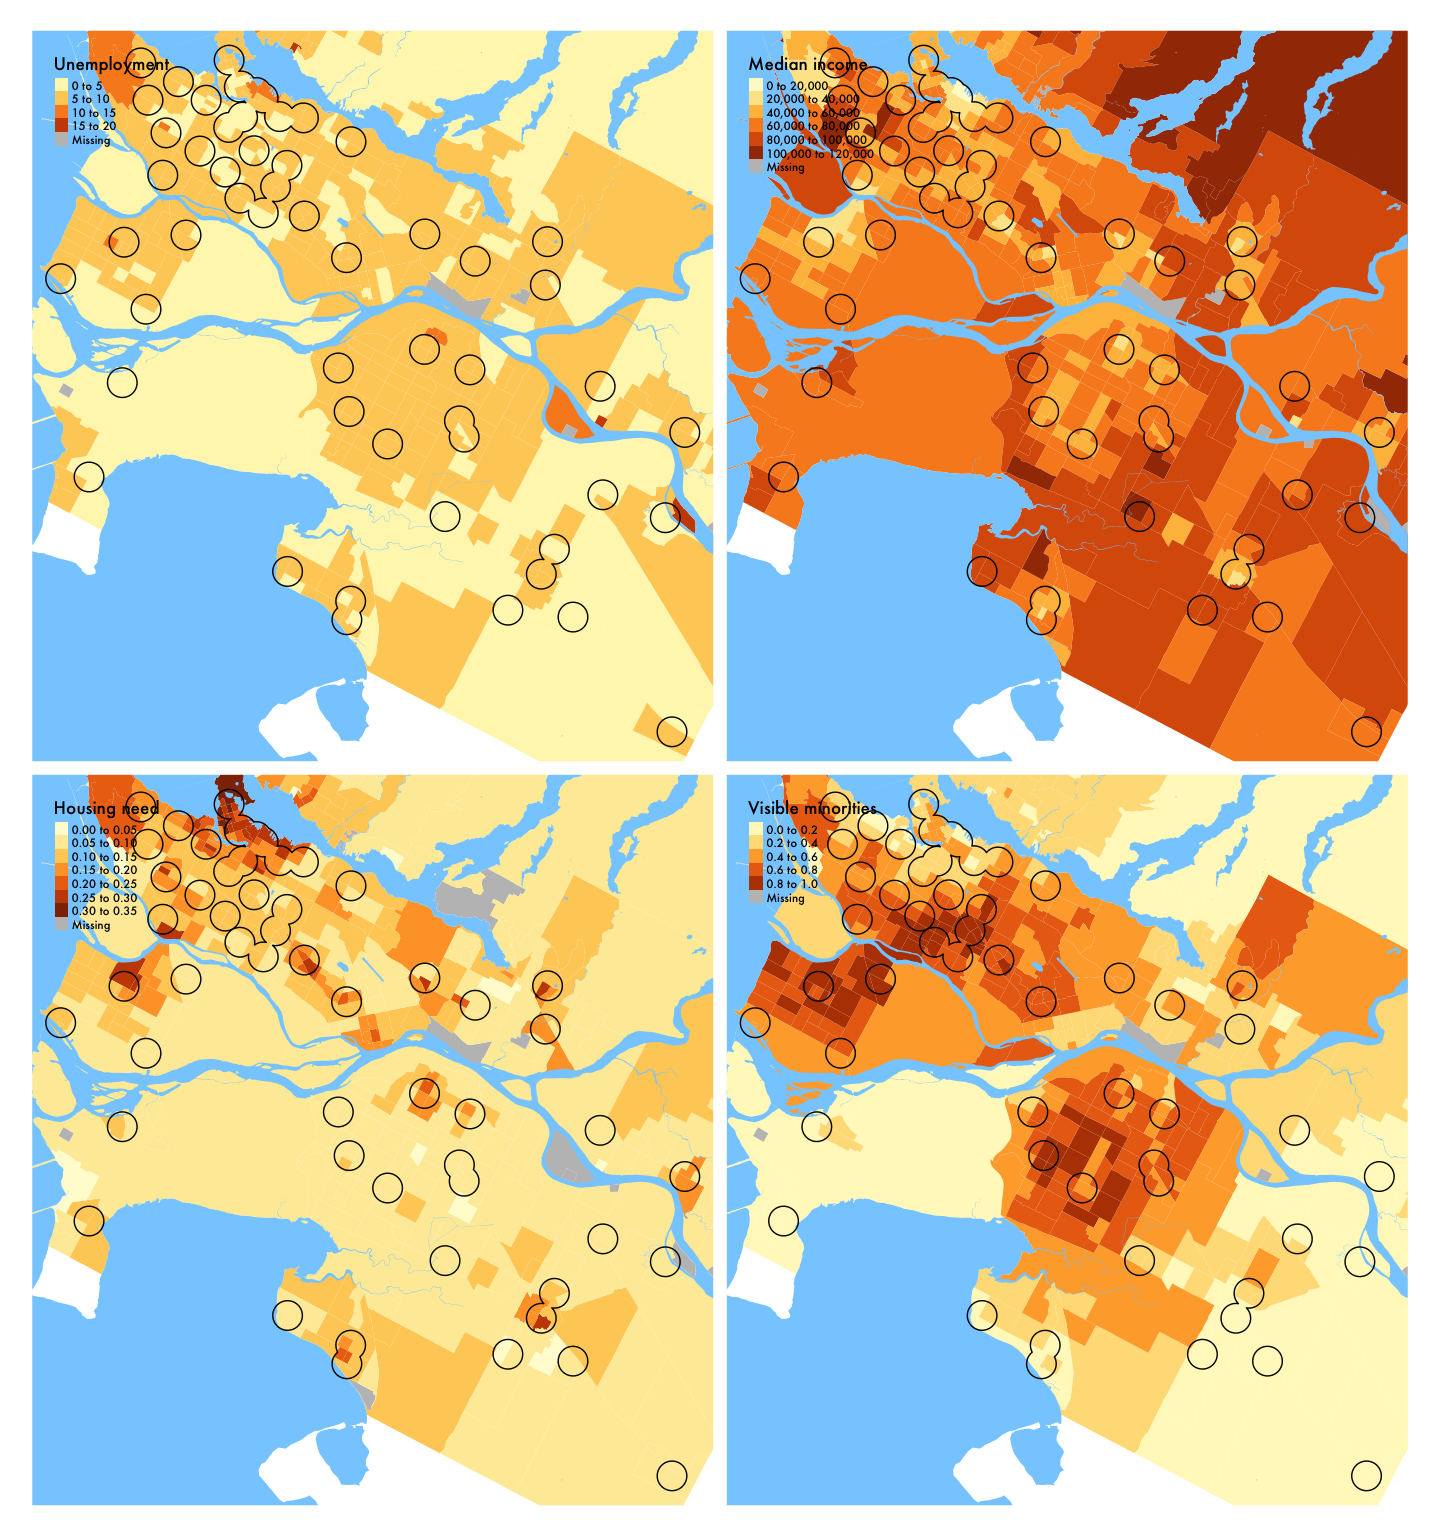
Figure 10: Demographic variables in Vancouver (library service area), 2016
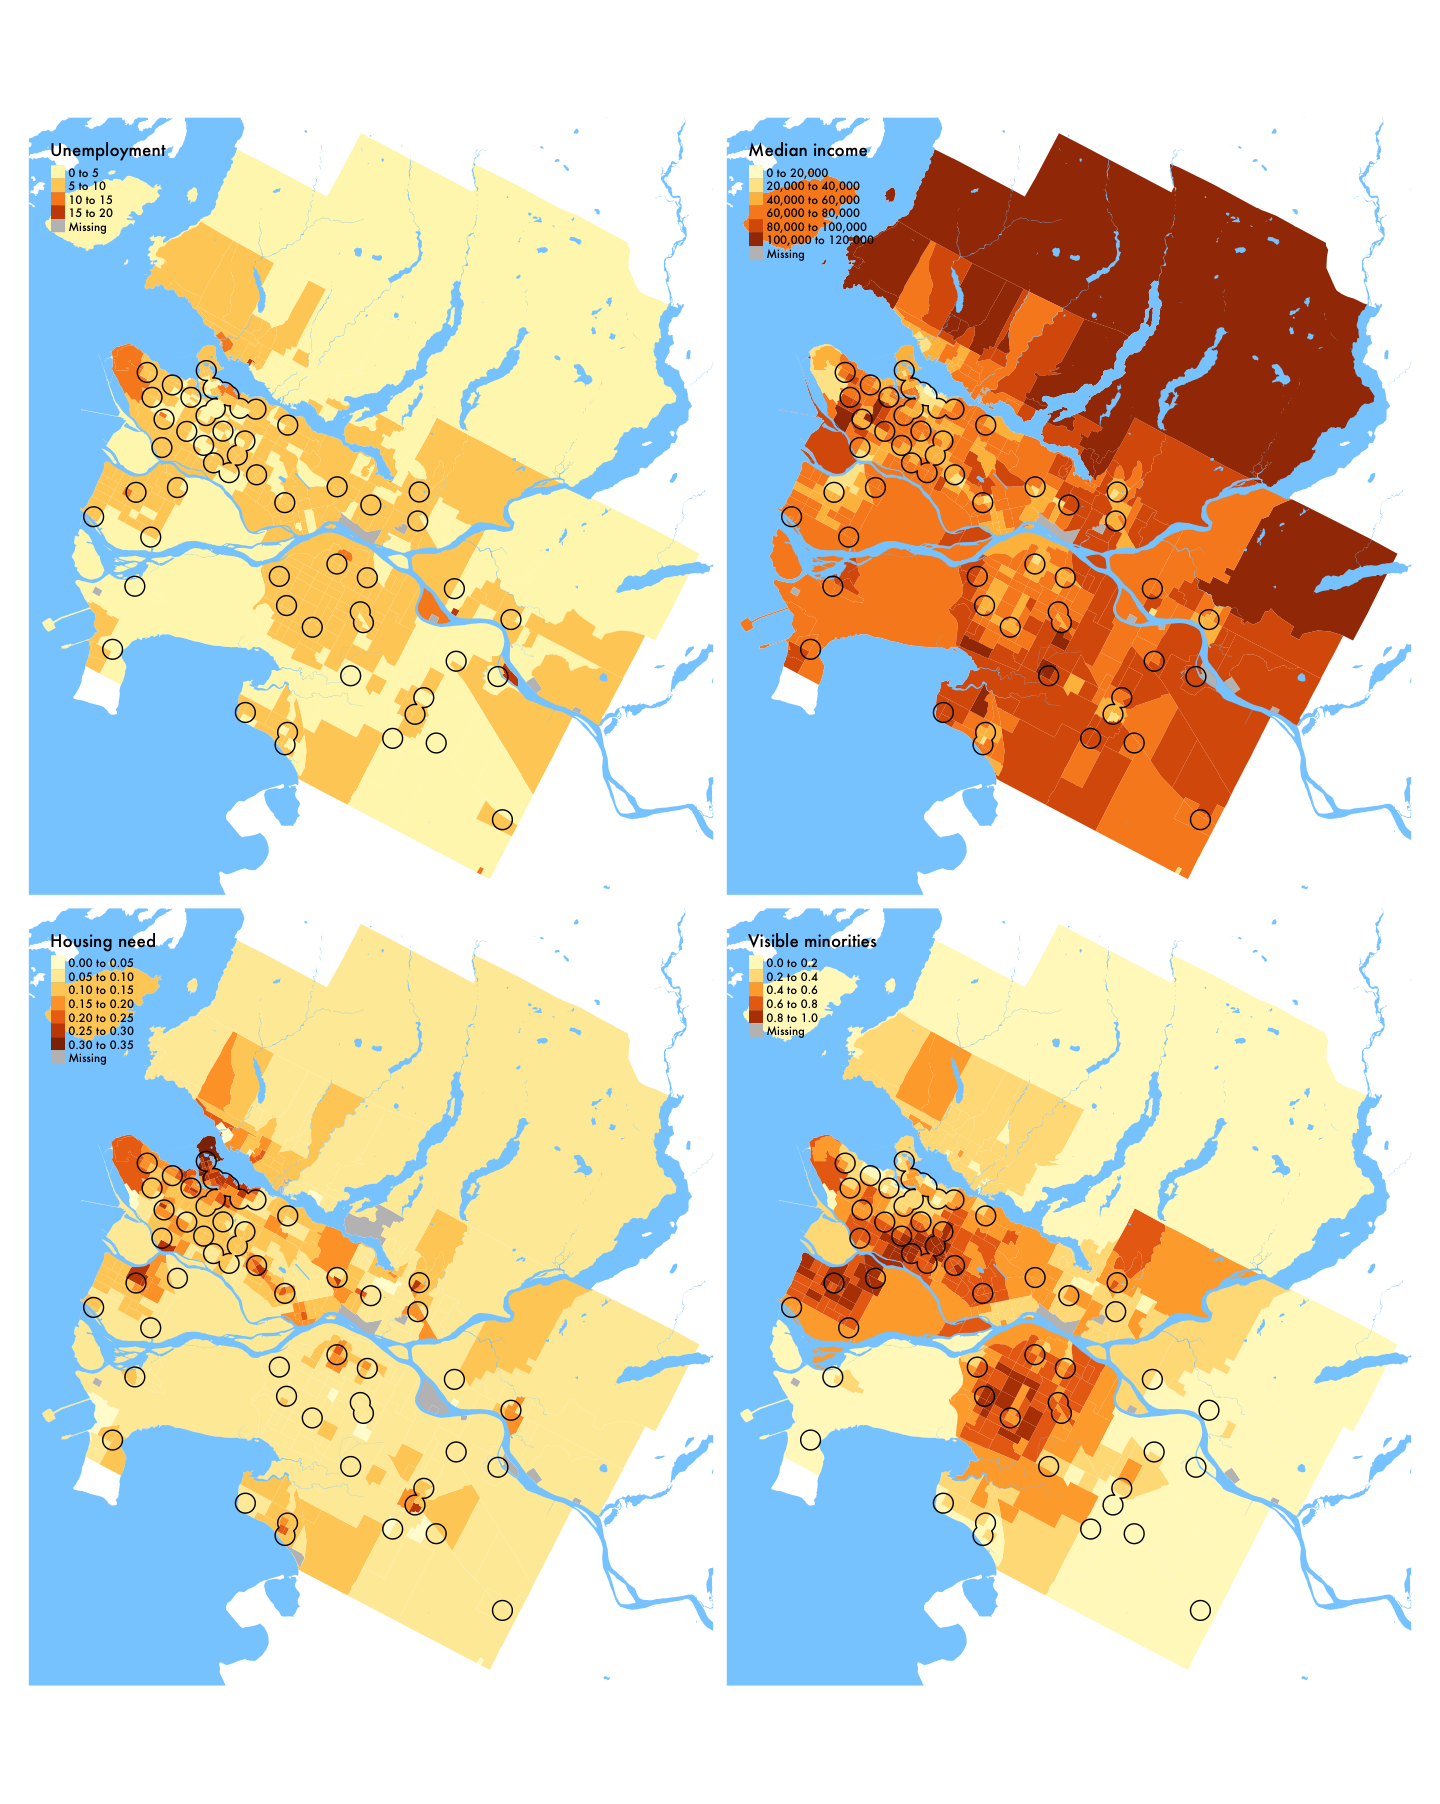
Figure 11: Demographic variables in Vancouver (region), 2016
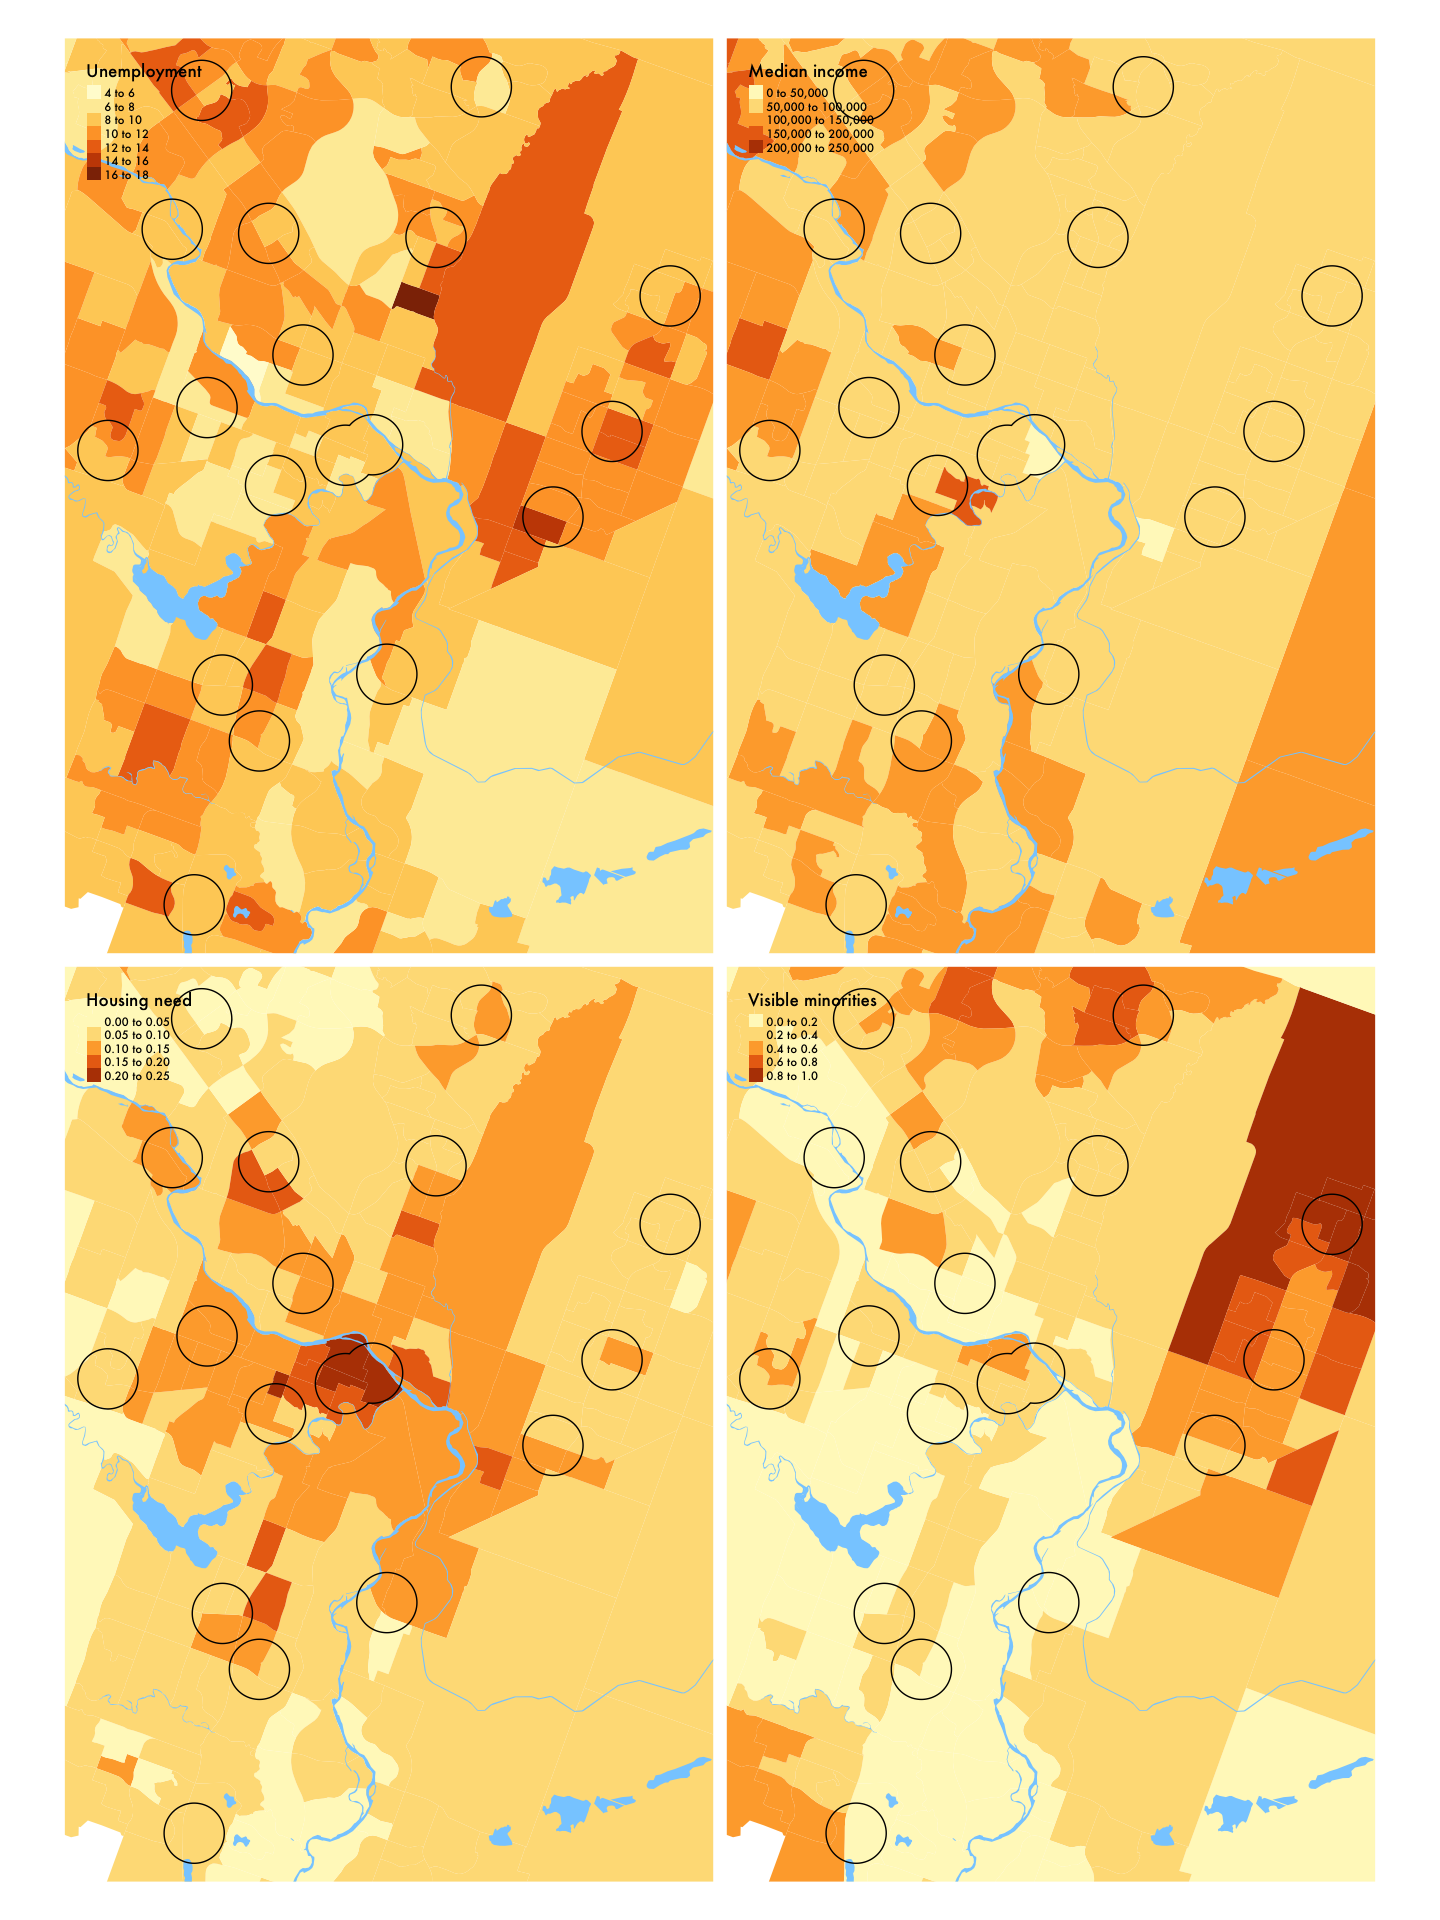
Figure 12: Demographic variables in Calgary (library service area), 2016
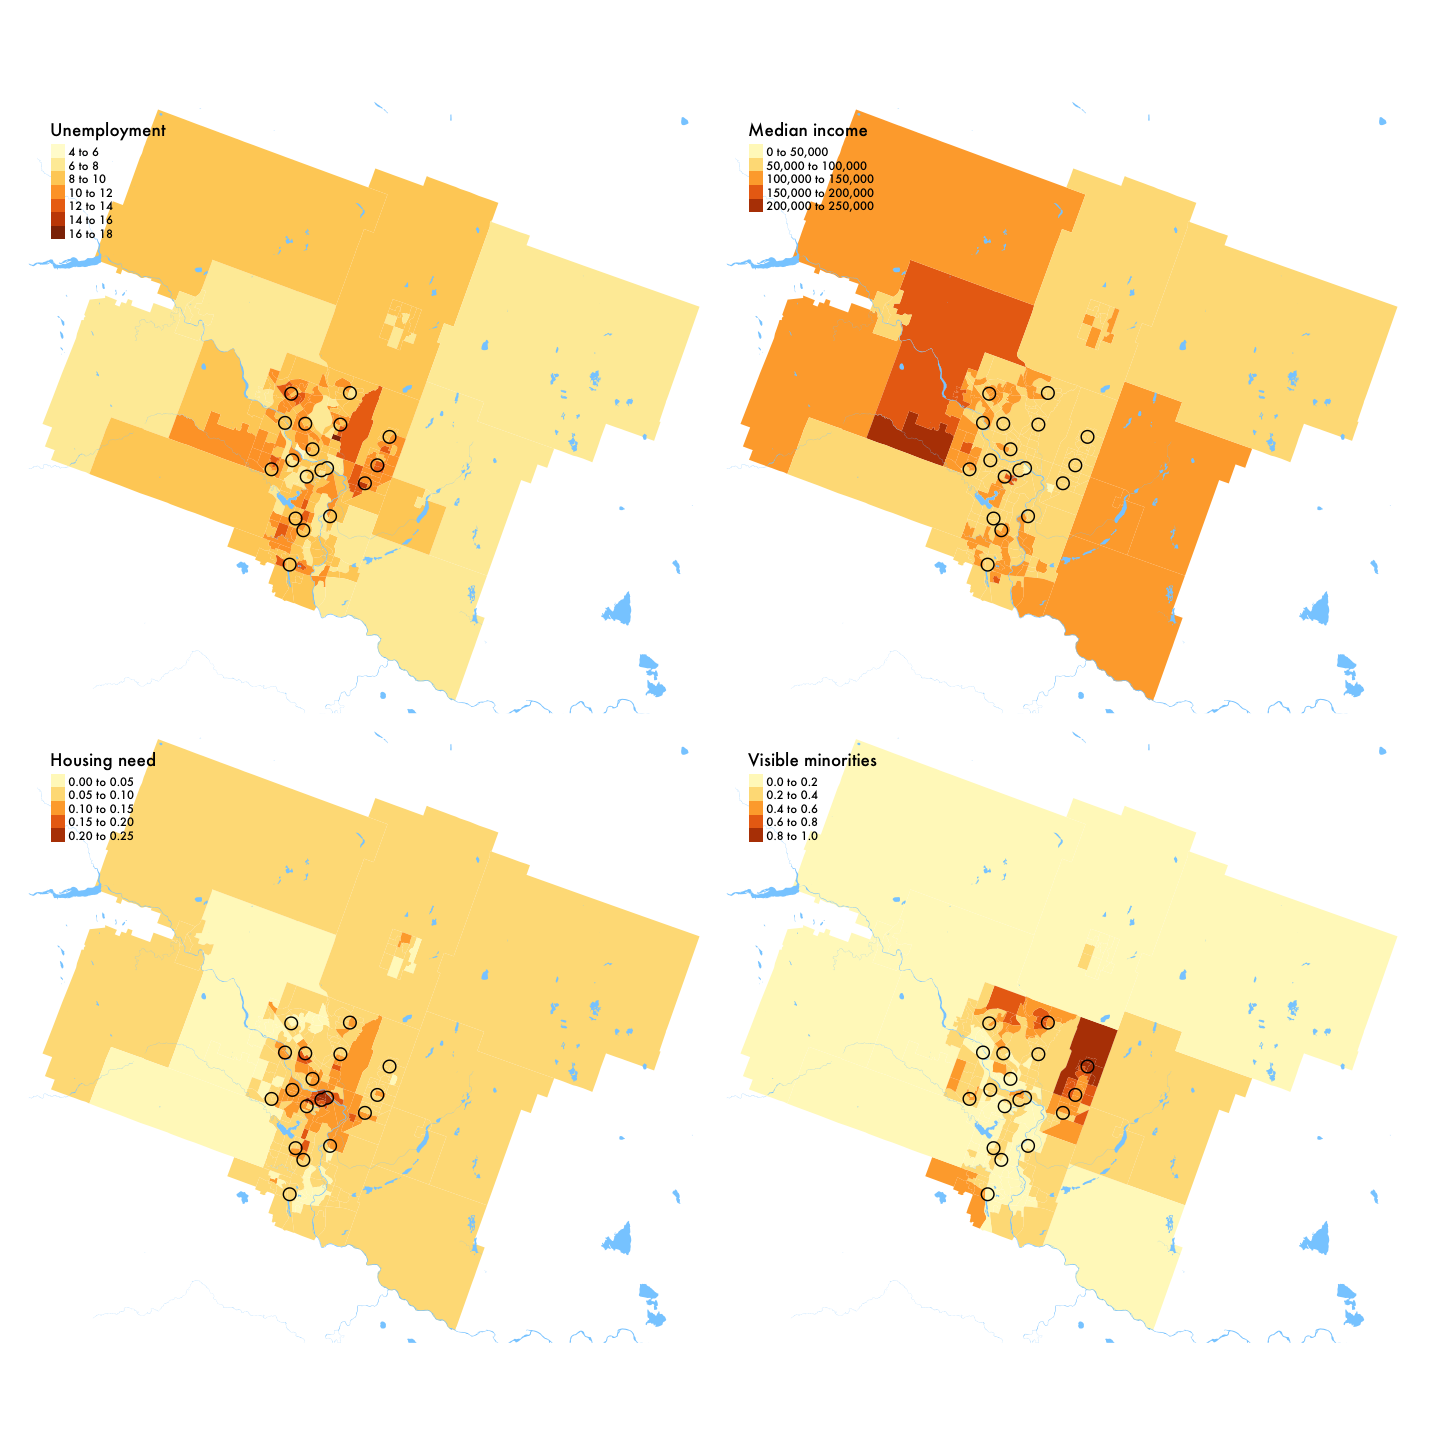
Figure 13: Demographic variables in Calgary (region), 2016
Charlotte Belot
Post-graduate research assistant
My research interests include participatory urban design/planning, design/data visualization, and housing justice.